General SEO Statistics
Zuerst befassen wir uns mit ein paar allgemeinen Statistiken rund um Suchmaschinen und Suchmaschinenoptimierung. Wichtig ist zu erwähnen, dass die Statistiken nicht von mir selbst stammen, sondern dass ich diese aus bestehenden Studien, Blogbeiträgen und Berichten zusammengetragen habe via Google.
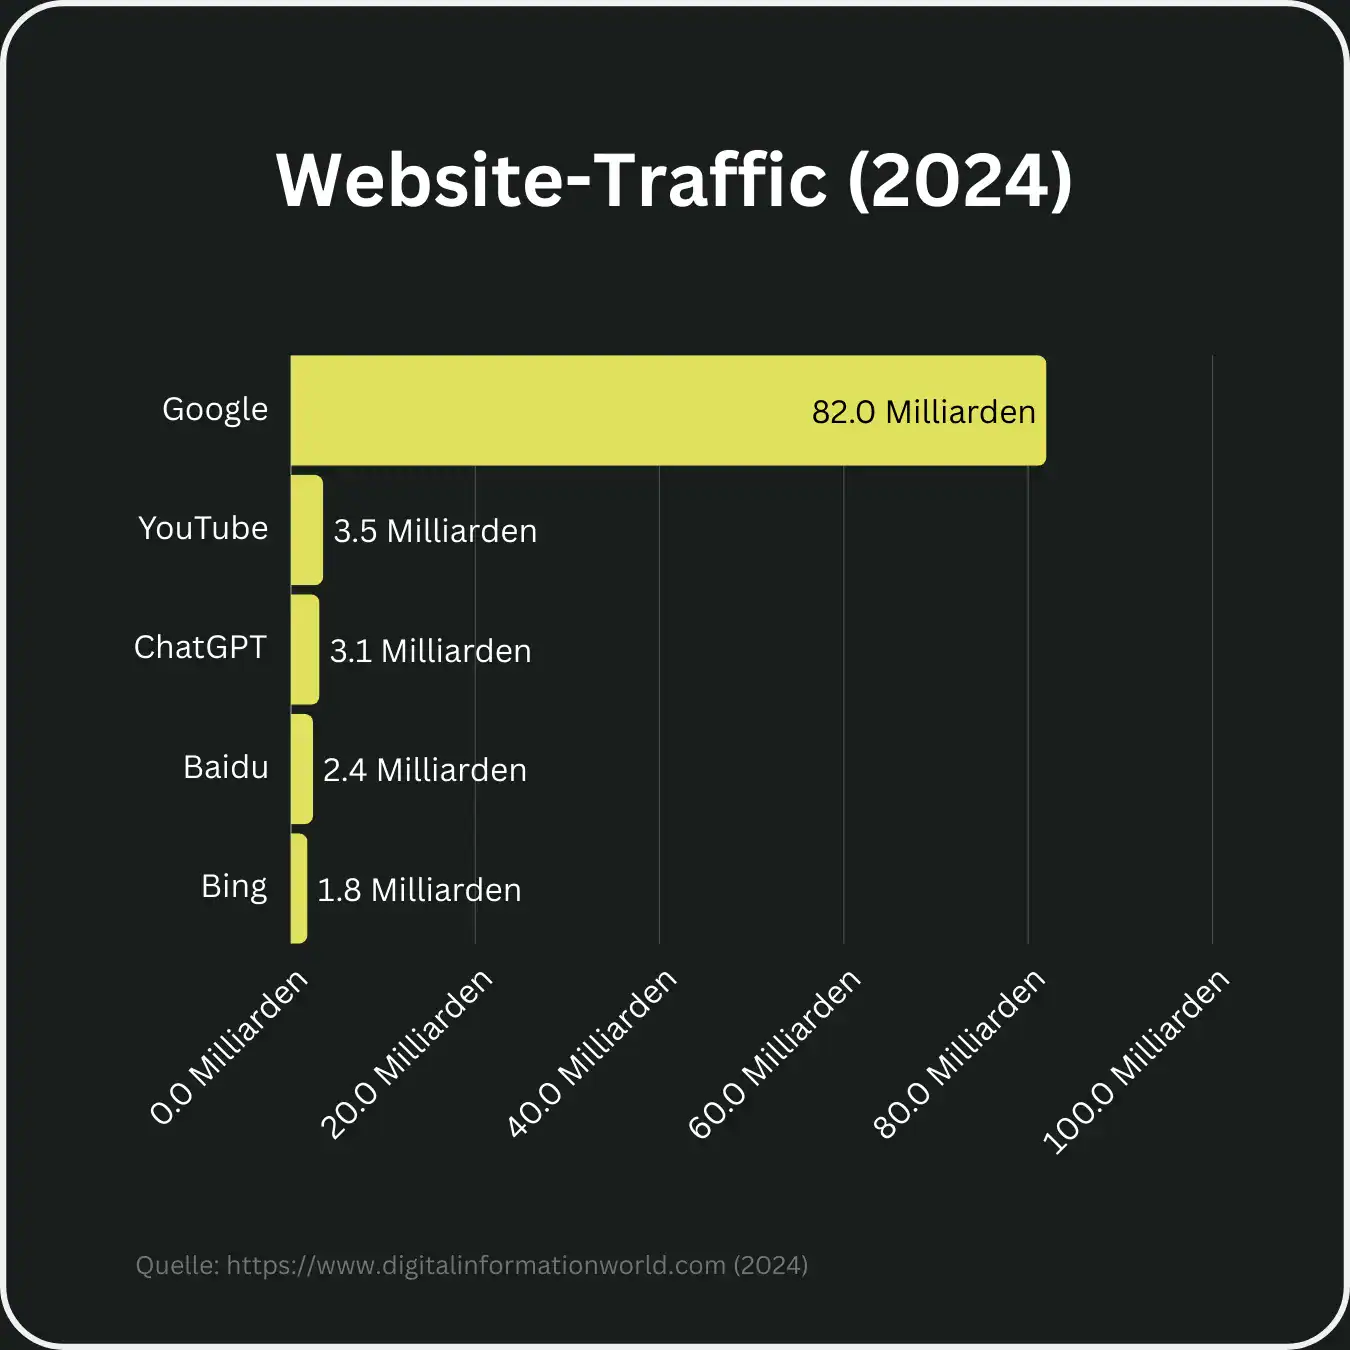
Market share of Google vs. YouTube vs. ChatGPT:
Google dominates the global search engine market with an estimated 82 billion search queries per year.
(Source: Digital Information World.com, 2024)
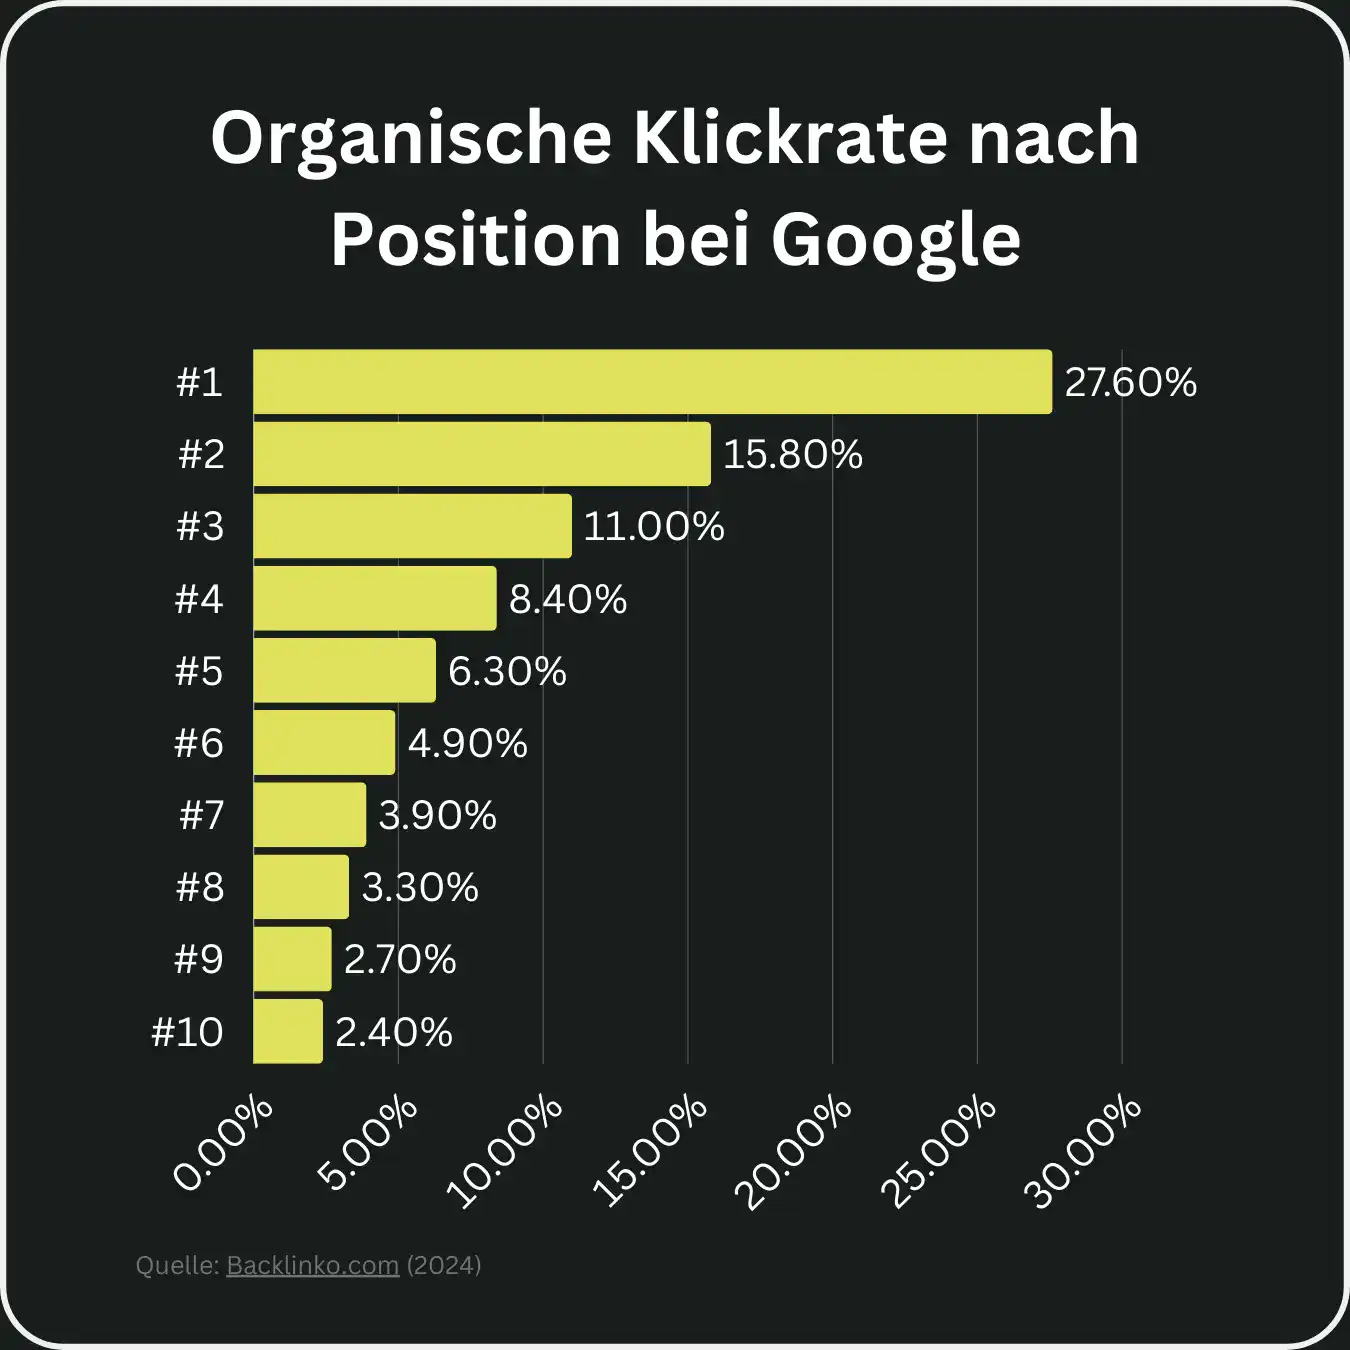
Click-Through-Rate der Top -10-Suchergebnisse:
The average click-through rate (CTR) for the first search result on Google is 27.6%.
(Source: Backlinko, 2022)
Marketing channel with the highest ROI:
49% of marketers report that organic search offers the best ROI of all marketing channels.
(Quelle: Search Engine Journal, 2023)
Percentage of web traffic from Google:
57.8% of global web traffic comes from organic Google search.
(Quelle: Sparktoro, 2023).
Percentage of new search queries on Google:
15% of all Google searches are new and have never been made before.
(Google, 2022)
Percentage of new search queries on Google:
The average length of content on the first page of Google search results is 1,447 words.
(Source: Backlinko, 2022).
Durchschnittliche Verweildauer bei Top-10-Seiten:
The average time spent on a top-10 page is 2.5 minutes.
(Source: Backlinko, 2022).
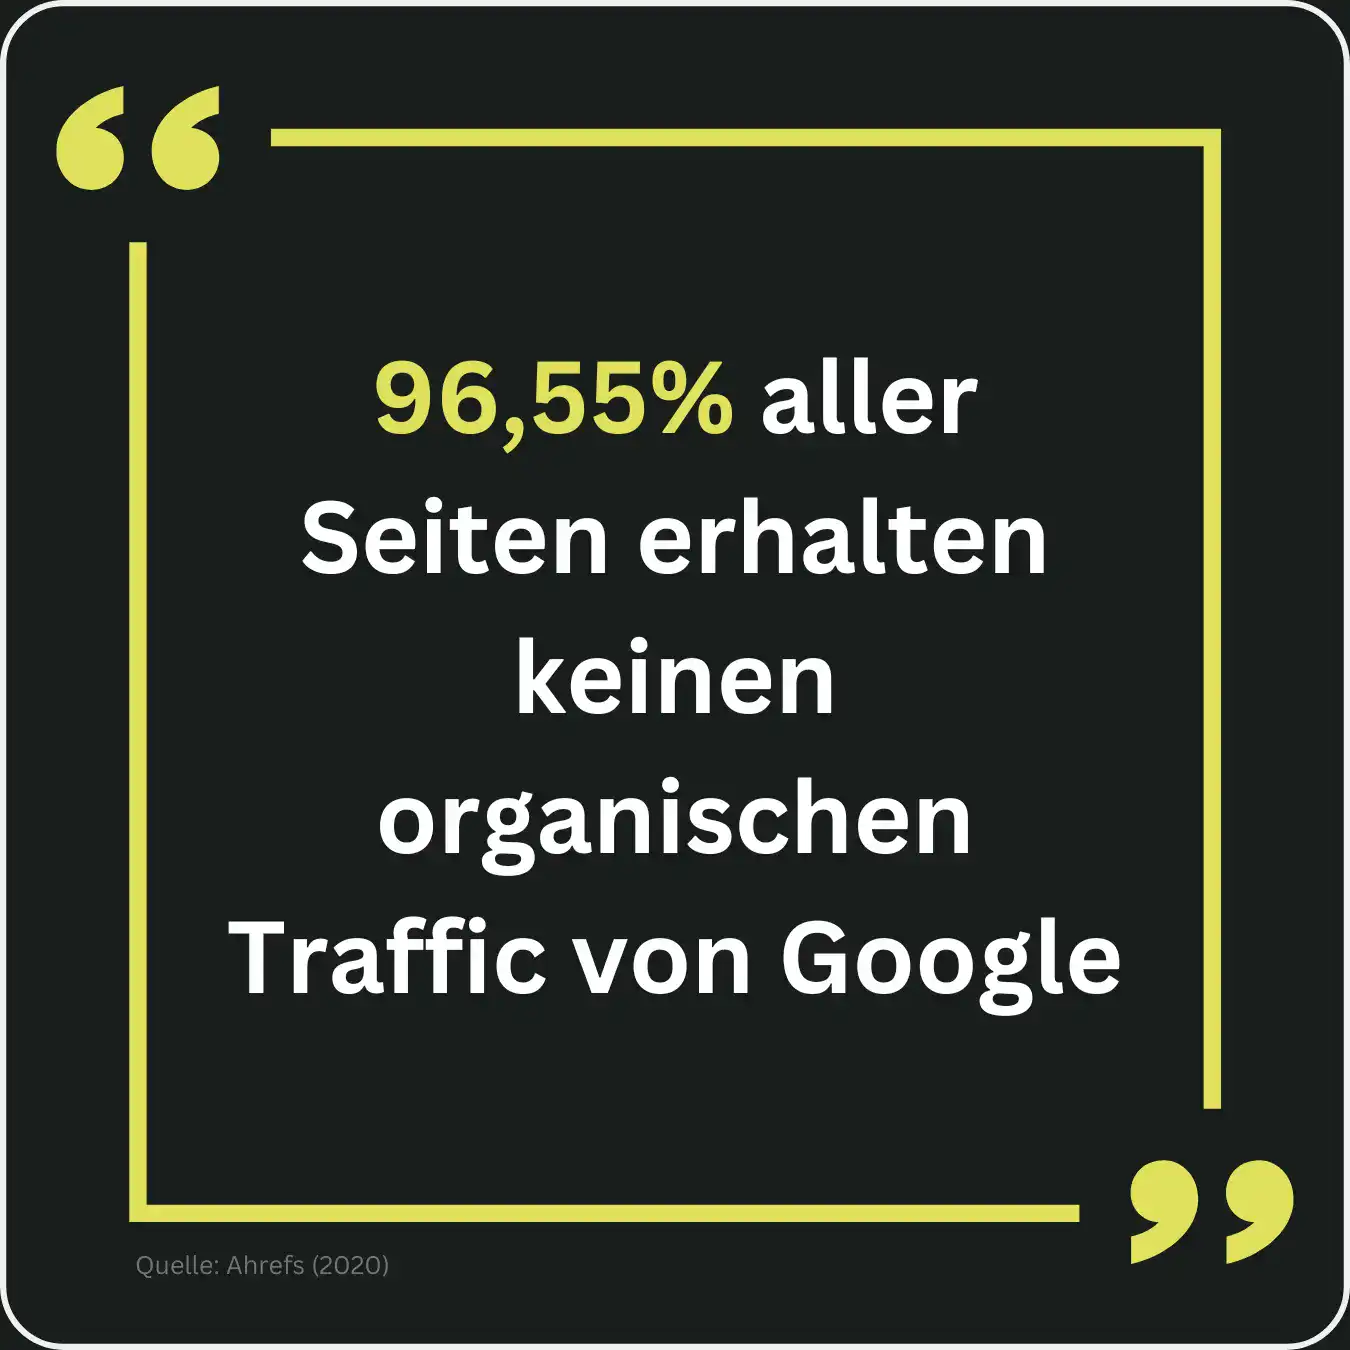
Percentage of websites without organic traffic:
96,55% aller Seiten erhalten keinen organischen Traffic von Google.
(Source: Ahrefs, 2020)
Prozentsatz an Websites, welche Top -10-SERPs erreichen:
Only 5.7% of all pages reach the top 10 results within a year of publication.
(Source: Ahrefs, 2020).
Durchschnittliches Alter von Top -10-Seiten:
The average top-10 page is over two years old.
(Quelle: Ahrefs, 2020).
Mobile SEO Statistics
In this section, we’ll focus on mobile websites and mobile optimization, which play a crucial role in the success of any SEO campaign.
Percentage of search queries from mobile devices:
58% of all search queries are made on mobile devices.
(Quelle: Statista, 2023)
Impact of mobile optimization on session duration:
Mobile pages that load within 5 seconds have a 70% longer session duration.
(Quelle: Google, 2022)
Einfluss der mobilen Ladezeiten auf die Bounce-Rate:
53% of mobile users leave a page if it takes longer than 3 seconds to load.
(Source: Google, 2022)
Use of search engines on mobile devices:
87% of smartphone users use search engines at least once a day.
(Source: Statista, 2023)
Impact of mobile optimization on the percentage of returning visitors:
Mobile-friendly websites are 32% more likely to be revisited by users.
(Source: Google, 2022)
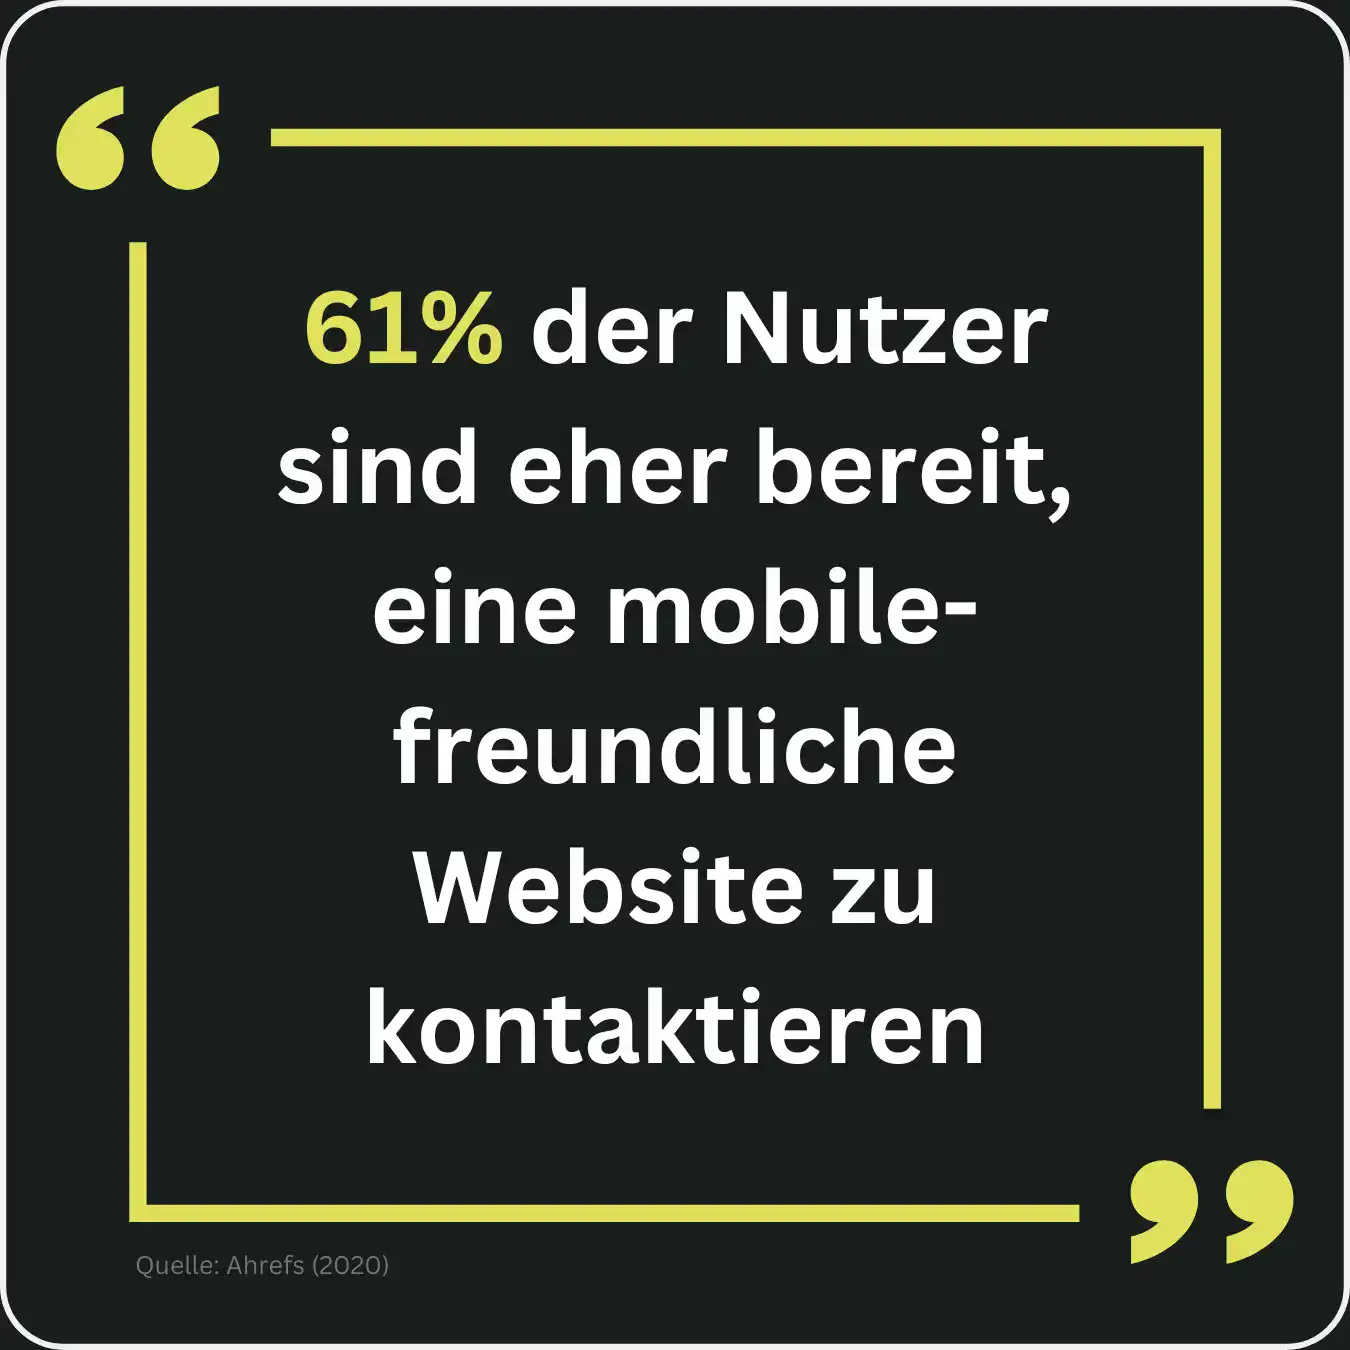
The Impact of Mobile Optimization on Lead Generation:
61% of users are more likely to contact a mobile-friendly website.
(Source: Ahrefs, 2020)
The Impact of Mobile Optimization on Website Visitors:
46% of users say they would not return to a poorly functioning mobile website.
(Source: Google, 2022)
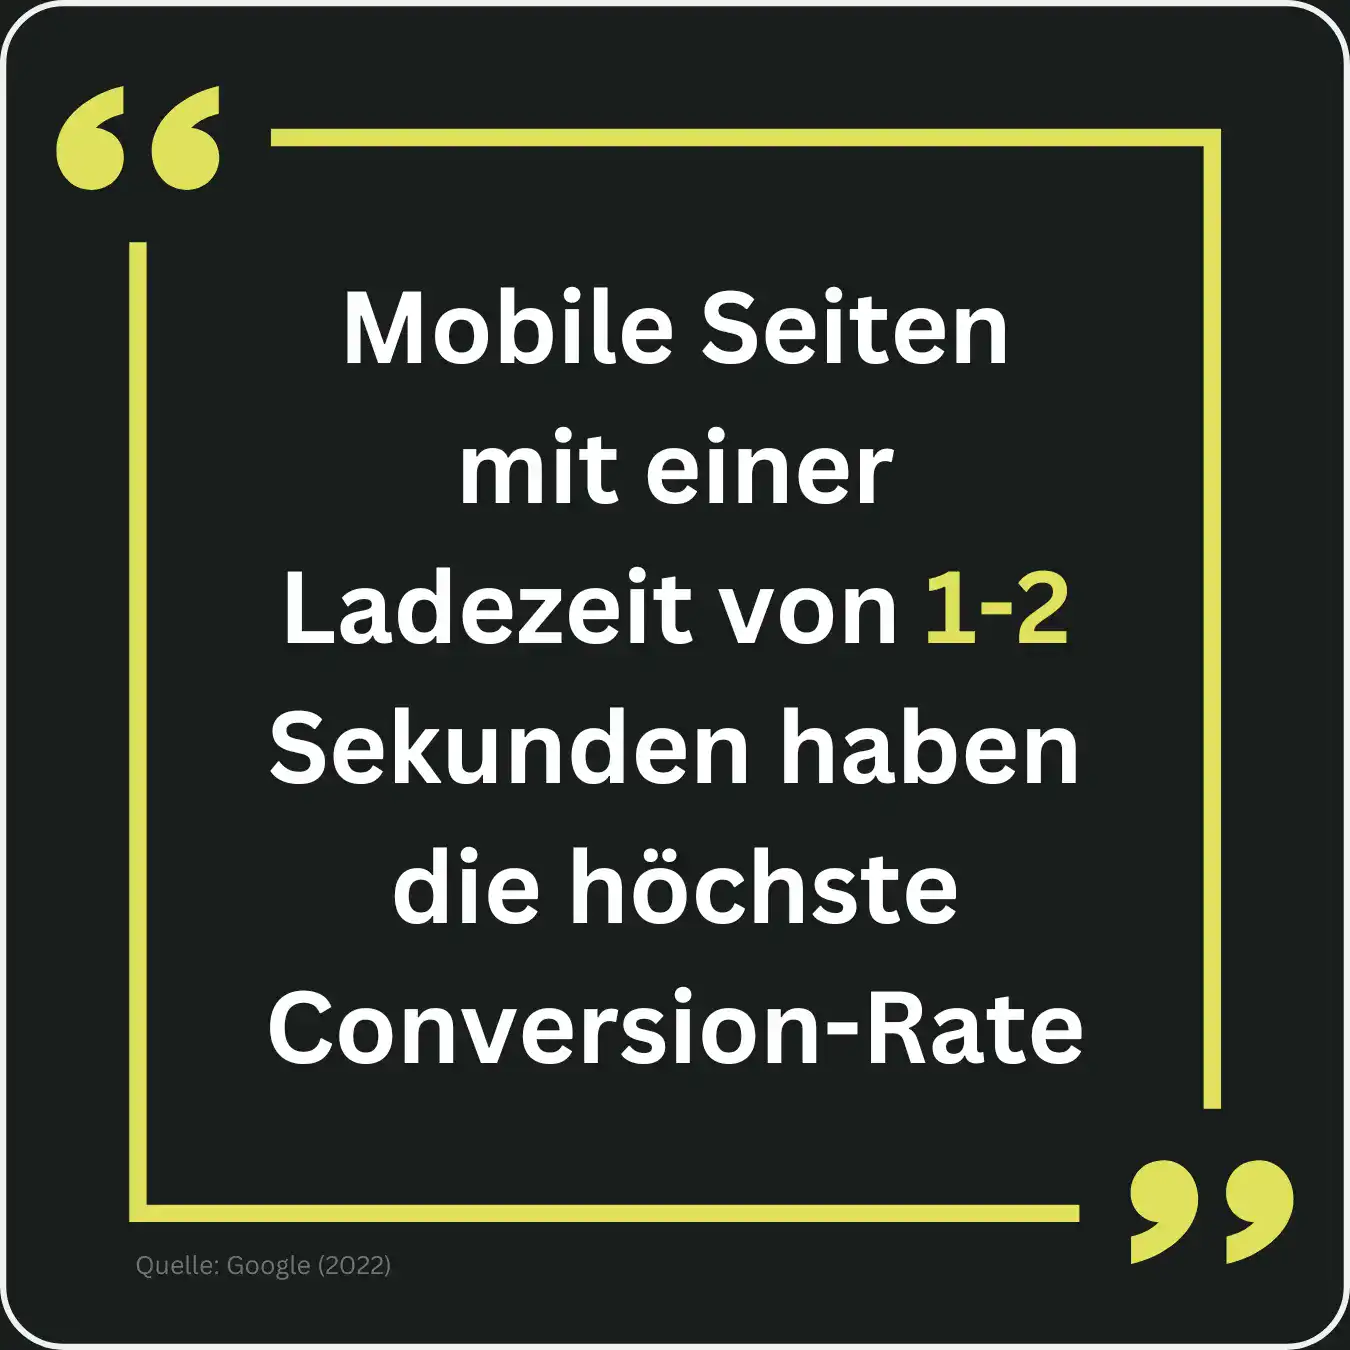
Mobile pages that load in 1–2 seconds have the highest conversion rate.
(Source: Google, 2022)
Percentage of mobile search queries resulting in customer actions:
70% of mobile search queries result in an action within an hour.
(Quelle: Google, 2022)
Local SEO Statistics
Local SEO is playing an increasingly important role. Here are the key statistics on local search queries.
Percentage of search queries with local intent:
46% of all Google searches are location-based.
(Source: Search Engine Roundtable, 2023)
Percentage of local search queries that result in a visit to the business:
76% of users who perform a local search on their smartphone visit a store within a day
(Source: Google, 2022).
Percentage of local search queries that result in a purchase:
28% of all local search queries result in a purchase.
(Source: Ranktracker, 2022)
Percentage of local search queries that lead to an offline purchase:
78% of location-based mobile searches result in an offline purchase.
(Source: Search Engine Land, 2014).
The importance of page #1 in local search results:
92% of searchers choose a business that appears on the first page of local search results
(SEO Tribunal, 2023).
Percentage of location queries via Google Maps:
86% of people look up a business's location on Google Maps.
(Source: SEO Tribunal, 2023).
Range of visitors from local search queries:
72% of consumers who perform a local search visit a store within an 8-kilometer radius.
(Source: HubSpot, 2023)
The value of online reviews compared to in-person reviews:
88% of consumers trust online reviews just as much as personal recommendations.
(Source: BrightLocal, 2023)
The value of online reviews compared to in-person reviews:
18% of mobile local search queries result in a purchase within one day.
(Google, 2022).
Voice Search SEO Statistics
Percentage of voice search in mobile search queries:
27% of online users worldwide use voice search on mobile devices.
(Source: Statista, 2023)
Using voice search for local searches:
58% of consumers use voice search to find information about local businesses.
(Source: BrightLocal, 2023)
Percentage of people who consider voice search to be part of their daily lives:
72% der Menschen, die Sprachassistenten nutzen, geben an, dass diese Teil ihres täglichen Lebens sind.
(Source: Google, 2022)
Average length of voice search queries:
Die durchschnittliche Länge eines Sprachsucheingaben beträgt 29 Wörter.
(Source: Backlinko, 2022).
Percentage of search results from HTTPS websites:
70.4% of search results come from HTTPS websites.
(Backlinko, 2022).
Percentage of featured snippets in voice search results:
40.7% of voice search results come from featured snippets.
(Source: Backlinko, 2022).
The Impact of Domain Authority on Voice Search Results:
Pages with high domain authority are more likely to appear in voice search results.
(Source: Backlinko, 2022).
Average load times for voice searches:
The average load time for a voice search result is 4.6 seconds.
(Source: Backlinko, 2022).
Share of the top 3 in search results
75% of voice search results come from the top three desktop results.
(Backlinko, 2022).
Video SEO Statistics
Videos werden immer ein wichtigeres Marketinginstrument und auch für SEO spielen sie eine entscheidende Rolle.
Im Folgenden sind die wichtigsten Video SEO-Statistiken im Überblick.
Percentage of marketers who use video marketing:
87% of marketers use video as a marketing tool.
(Source: Wyzowl, 2023)
YouTube's market share:
YouTube ist die zweitgrösste Suchmaschine weltweit.
(Alexa, 2023)
How popular are videos among consumers:
72% of consumers prefer videos to learn more about a product or service.
(Source: HubSpot, 2023)
Increasing Conversion Rates with Videos:
Videos on landing pages can increase conversion rates by up to 80%.
(Quelle: Tech.co, 2015)
Backlink Statistics
Contrary to Google’s claims, backlinks are still considered one of the top three ranking factors. I’ve summarized the most important backlink statistics for you in a concise overview.
Average number of backlinks on page #1:
The average number of backlinks for pages ranked first is 3.8 times higher than for pages ranked second through tenth
(Backlinko, 2020).
Percentage of pages that engage in link exchanges:
43,7% der Top-Ranking-Seiten verwenden wechselseitige Links.
(Source: Ahrefs, 2020)
Percentage of inactive backlinks:
66.5% of the links to websites over the past nine years are no longer active.
(Source: Ahrefs, 2020)
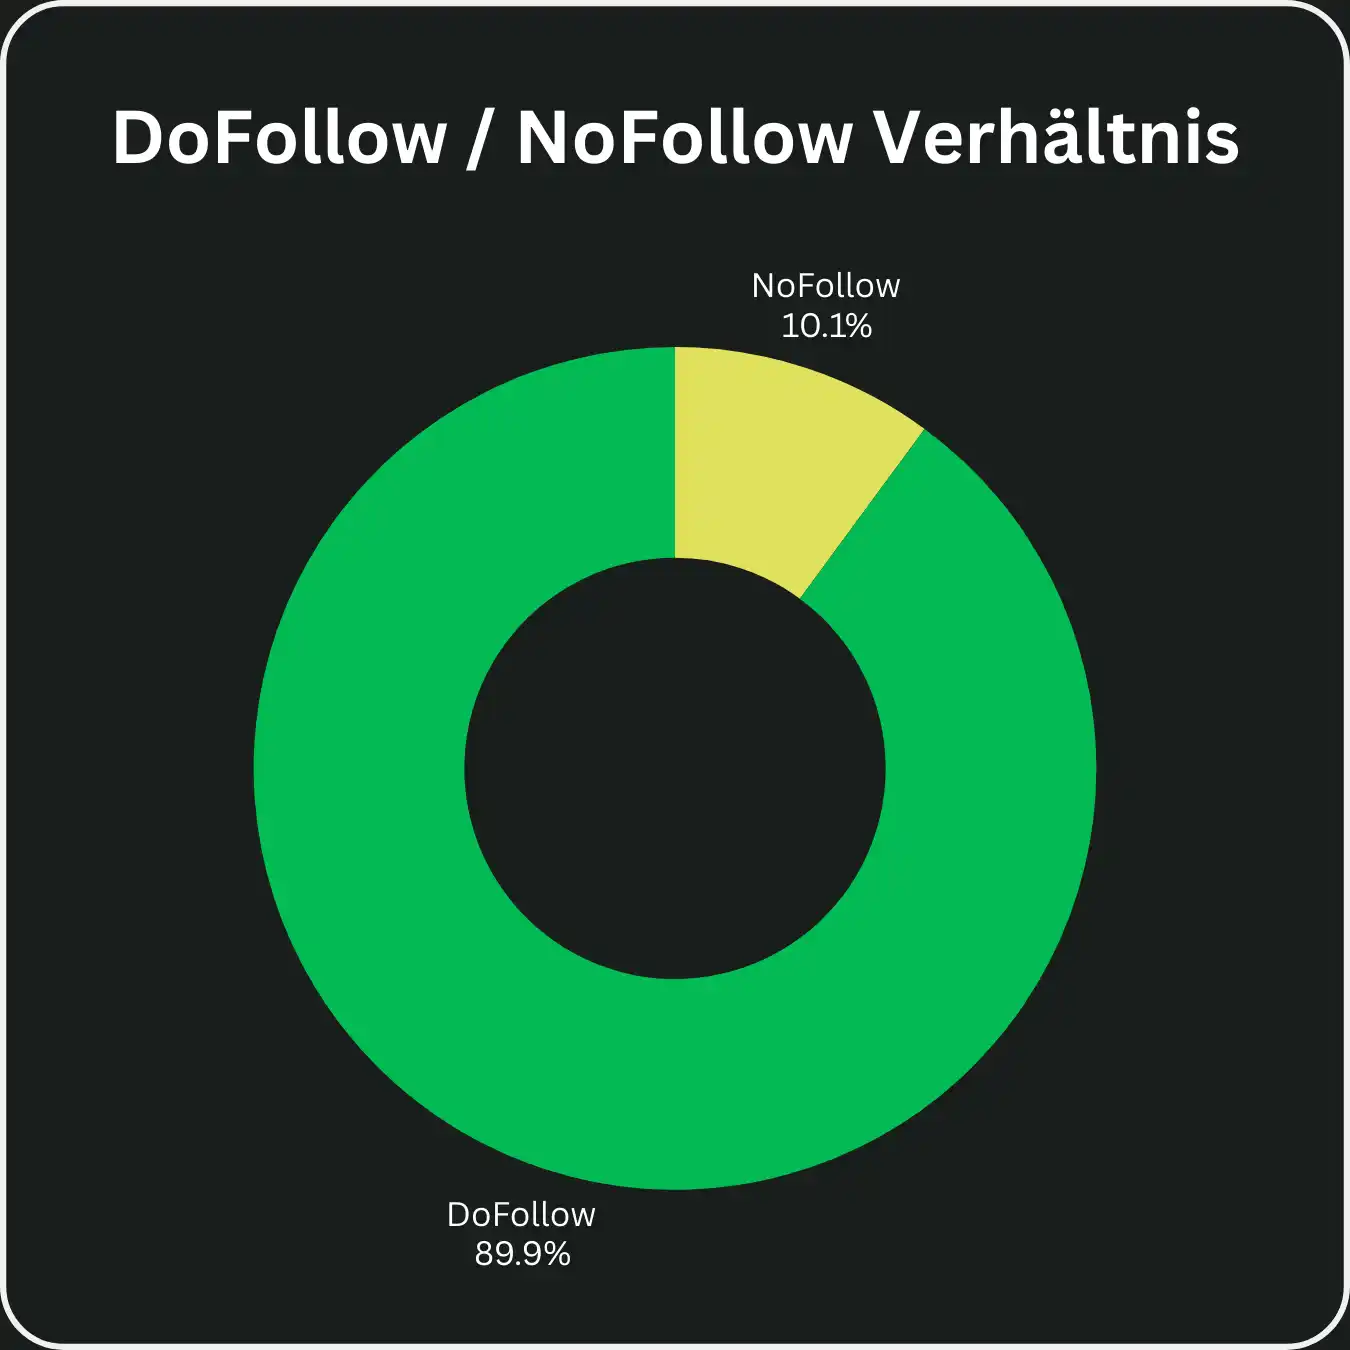
Percentage of nofollow links on top websites:
10.6% of all backlinks to the top 110,000 websites are "nofollow."
(Source: Ahrefs, 2020)
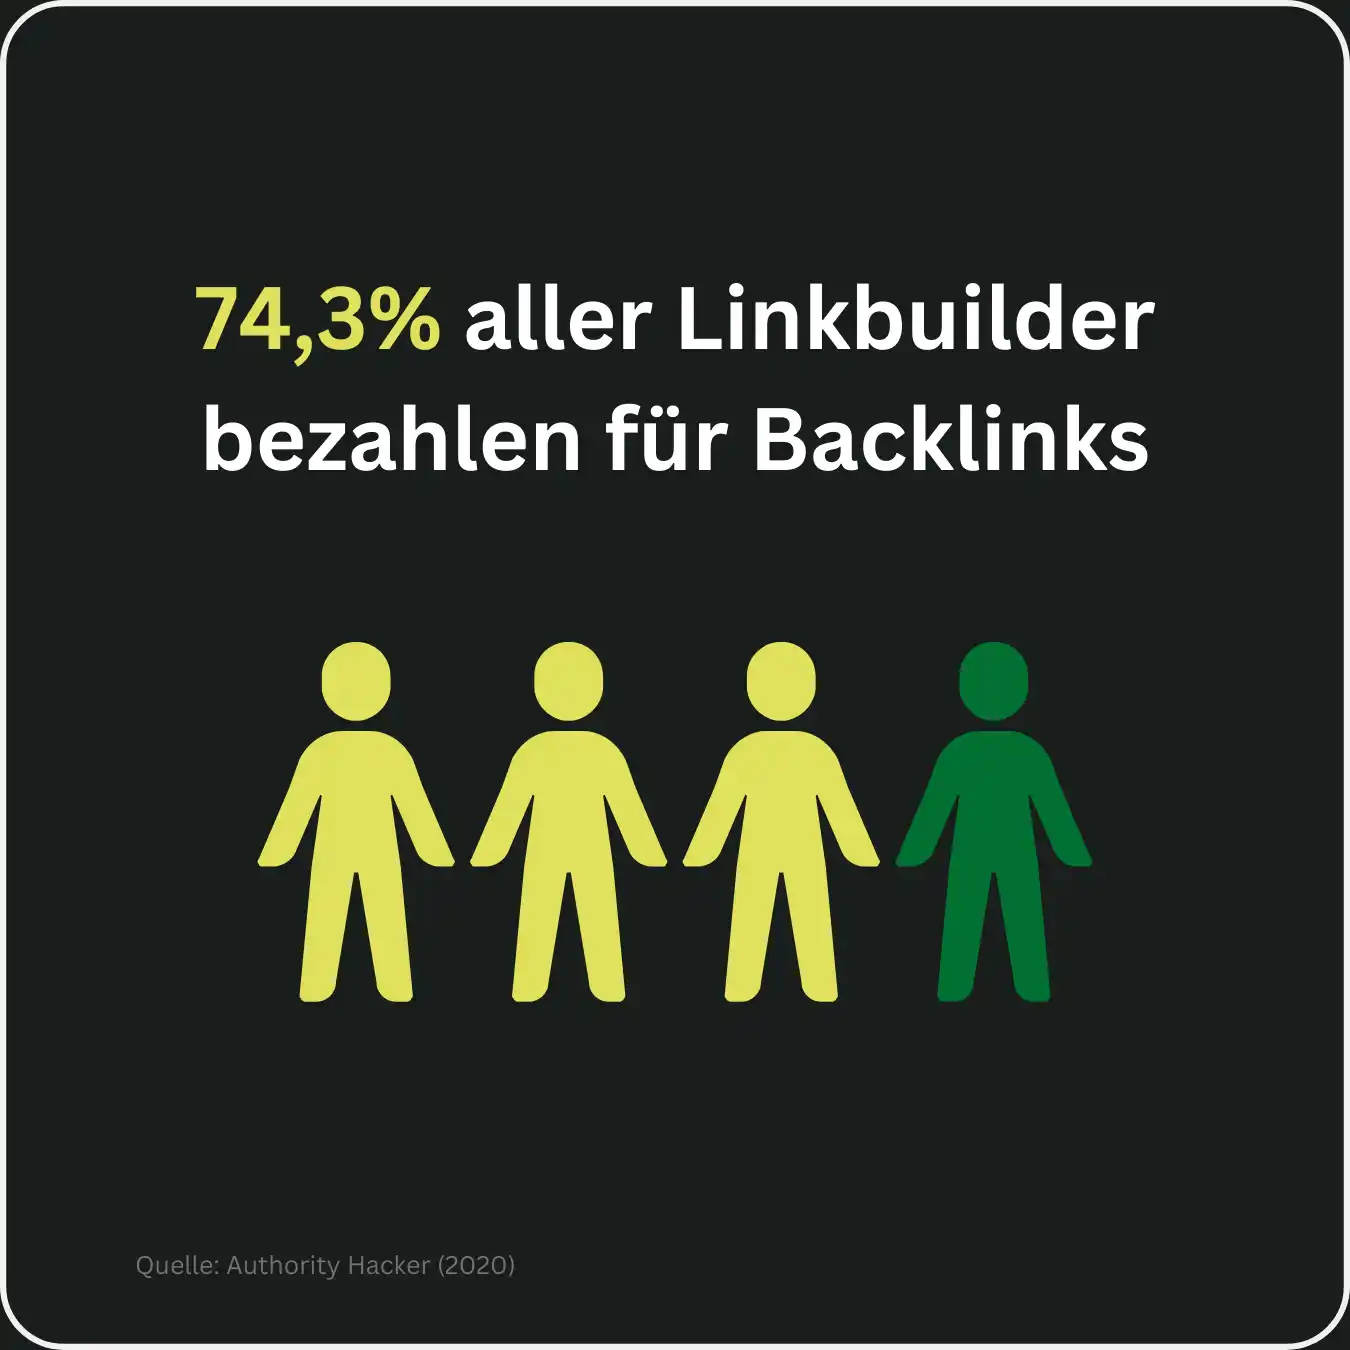
Percentage of link builders who pay for backlinks:
74,3% der Linkbuilder zahlen für Links
(Authority Hacker, 2020).
The average price for a paid link is $83
(Quelle: Authority Hacker, 2020)
Es dauert durchschnittlich 3,1 Monate, bis sich ein Link auf das Suchranking auswirkt
(Source: Authority Hacker, 2020)
96% of pages with 0 backlinks receive no organic traffic from Google
(Source: Ahrefs, 2020)
Seiten mit mehr Backlinks erhalten tendenziell mehr organischen Suchverkehr.
(Source: Ahrefs, 2020)
Es besteht eine positive Korrelation zwischen der Anzahl der verweisenden Domains und dem Ranking einer Seite.
(Source: Ahrefs, 2020)
SEO Content Statistics
Google is a text-based search engine. That’s why content is the cornerstone of any successful SEO strategy. Here’s an overview of the key facts and figures regarding on-page SEO.
Long-form content with over 3,000 words receives three times more traffic, four times more shares, and 3.5 times more backlinks than articles of average length.
(Source: SEMrush, 2020)
38% of users leave a website if the content is unappealing.
(Source: Adobe, 2020).
Content marketing costs 62% less than traditional marketing and generates about three times as many leads.
(Source: Demand Metric, 2020)
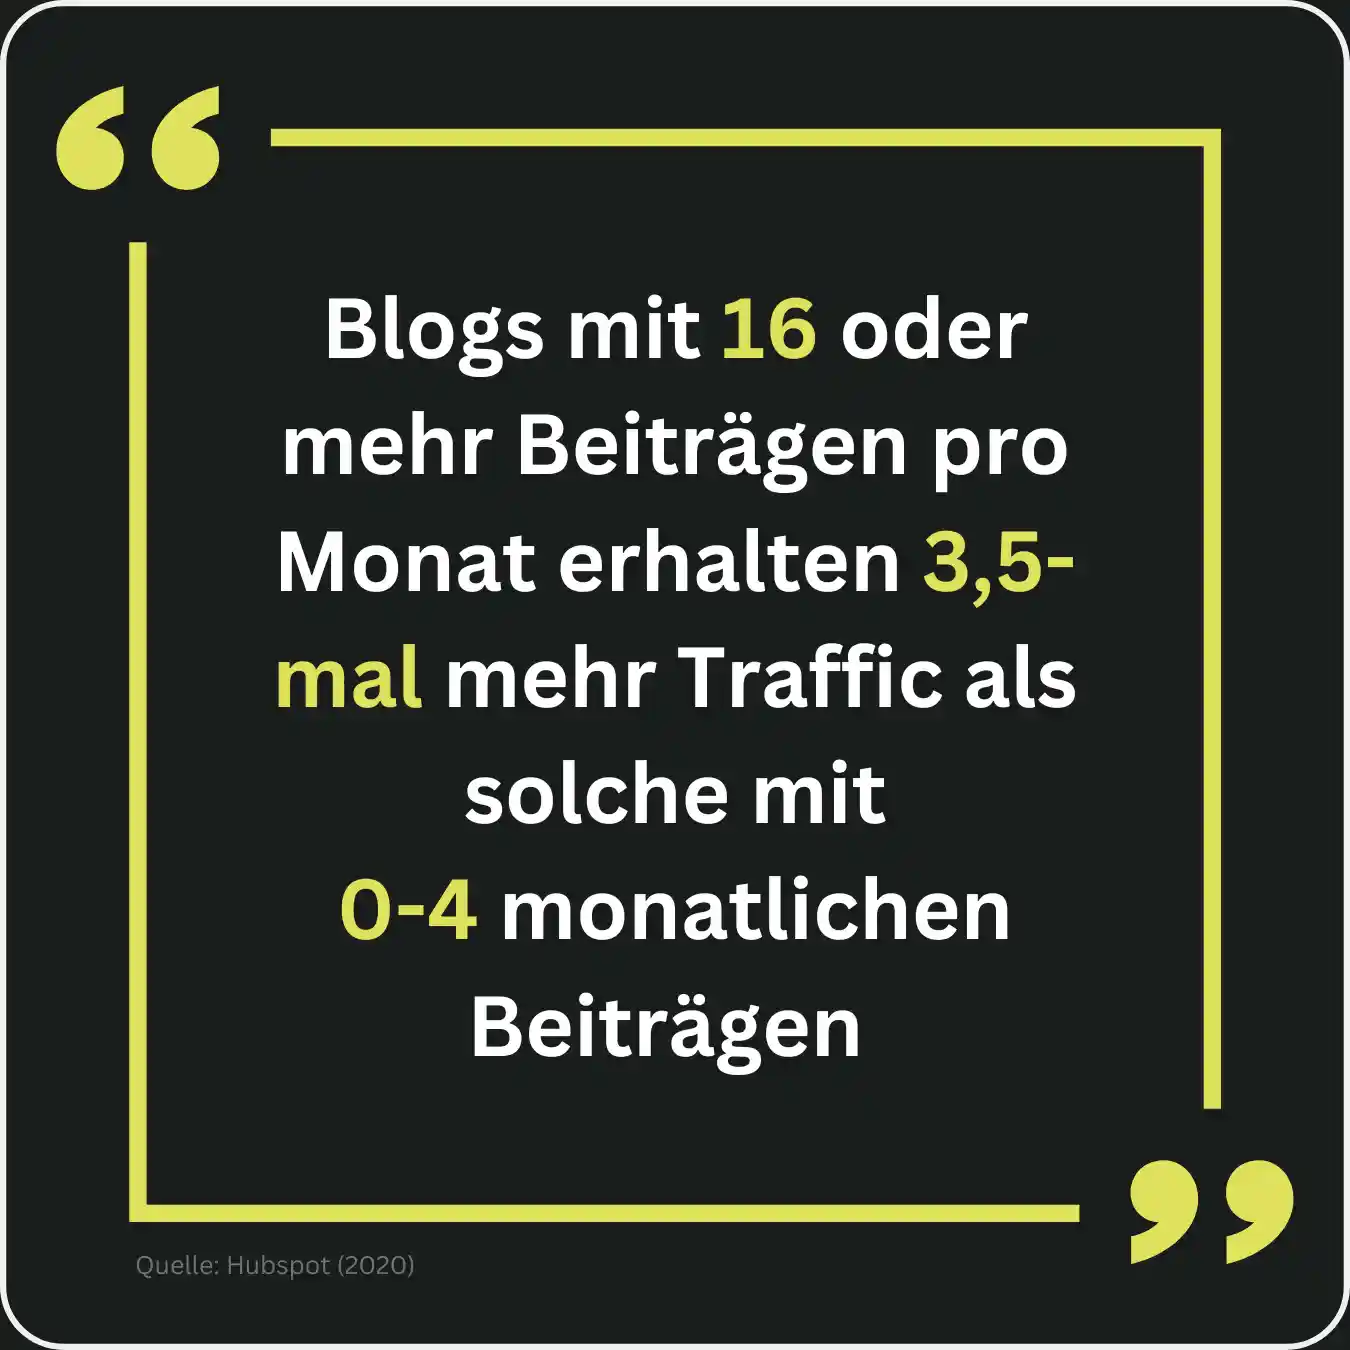
Blogs with 16 or more posts per month receive 3.5 times more traffic than those with 0–4 posts per month.
(Source: HubSpot, 2020)
47% of buyers consume 3–5 pieces of content before speaking with a sales representative.
(Source: Demand Gen Report, 2020)
Content marketing has a conversion rate that is six times higher than other methods.
(Source: ABG Essentials, 2020)
Companies that blog receive 97% more inbound links.
(HubSpot, 2020)
61% der Online-Käufer in den USA haben einen Kauf getätigt, nachdem sie Empfehlungen in einem Blog gelesen haben.
(Source: Content Marketing Institute, 2020)
Unternehmen mit Blogs erhalten 55% mehr Website-Besucher.
(Source: HubSpot, 2020)
80% of decision-makers prefer articles over ads when seeking information about a company.
(Source: Content Marketing Institute, 2020)
Technical SEO Statistics
Technisches SEO bleibt das unverzichtbare Fundament jeder erfolgreichen SEO-Strategie. Es mag allein nicht ausreichen, um Spitzenpositionen zu erreichen, ist jedoch die entscheidende Grundlage, um dieses Ziel überhaupt realisieren zu können.
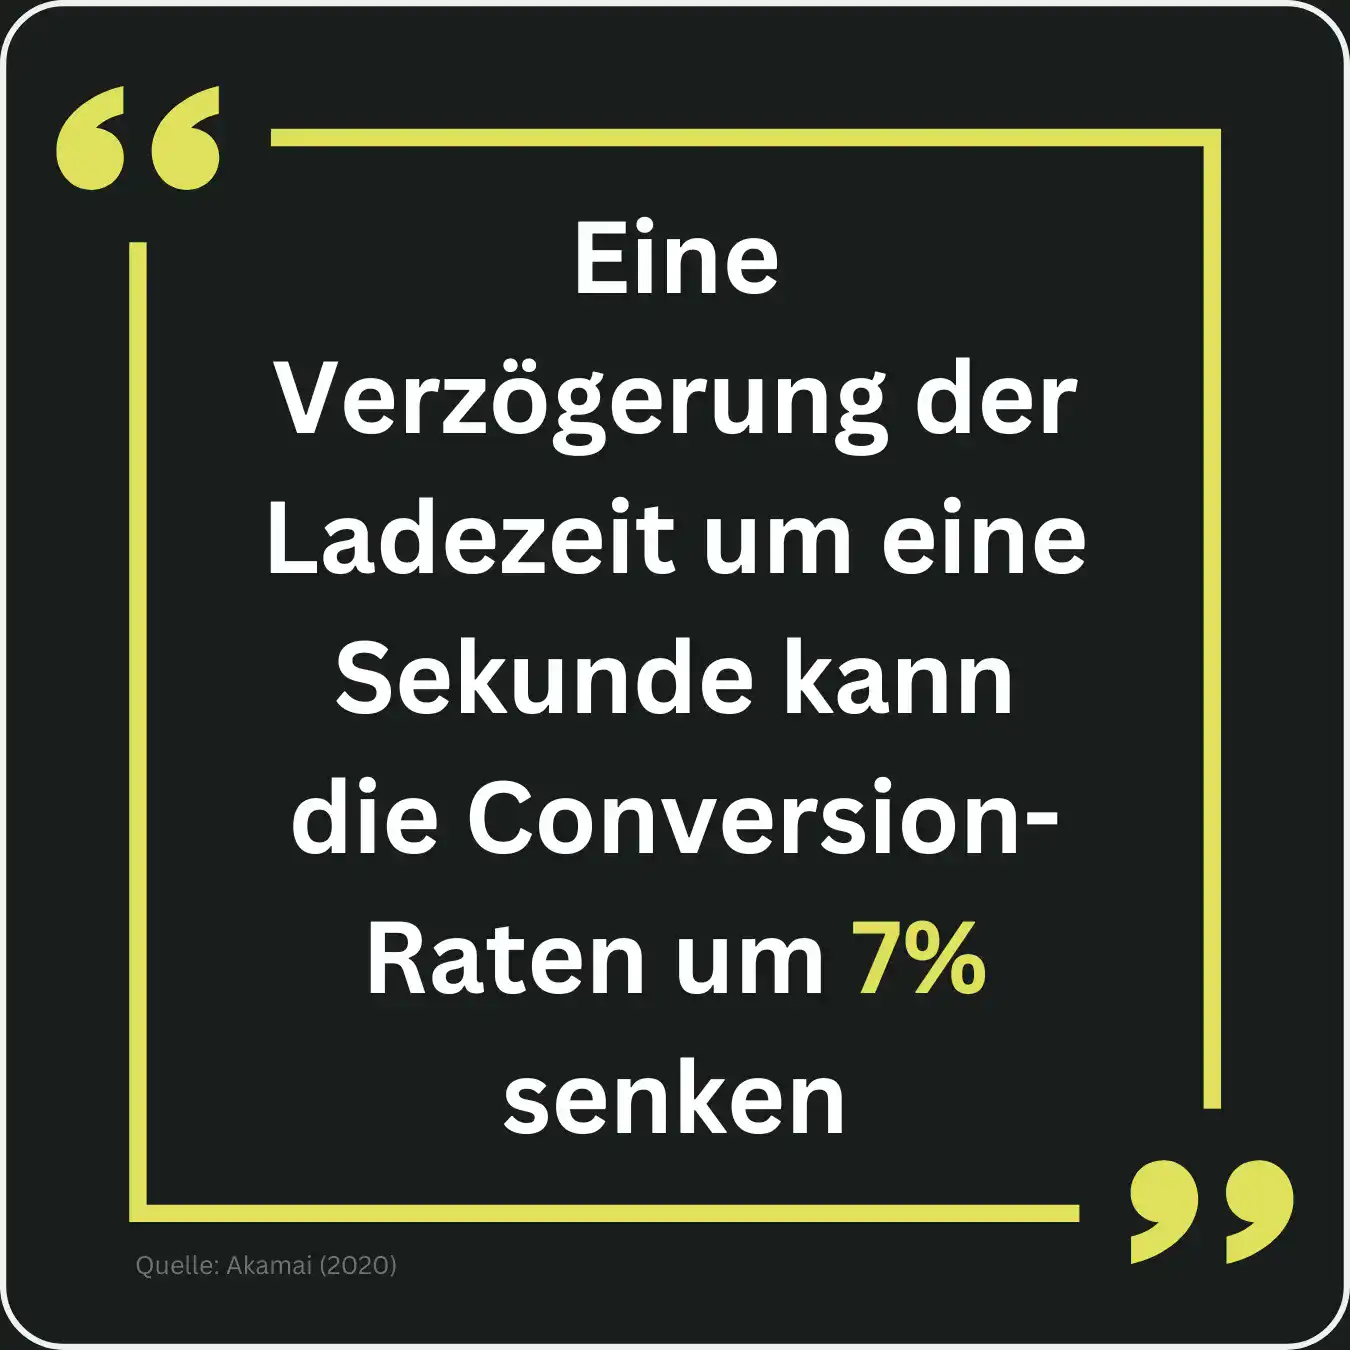
A one-second delay in loading time can reduce conversion rates by 7%.
(Source: Akamai, 2020)
40% of users leave a page that takes longer than 3 seconds to load.
(Akamai, 2020).
Pages that load in 2 seconds have an average bounce rate of 9%, while pages that load in 5 seconds have a bounce rate of 38%.
(Source: Pingdom, 2020)
Only 17% of websites use HTTP/2, even though it improves loading times.
(Quelle: W3Techs, 2020)
Pages that load in 1–2 seconds have the highest conversion rate.
(Source: Portent, 2020)
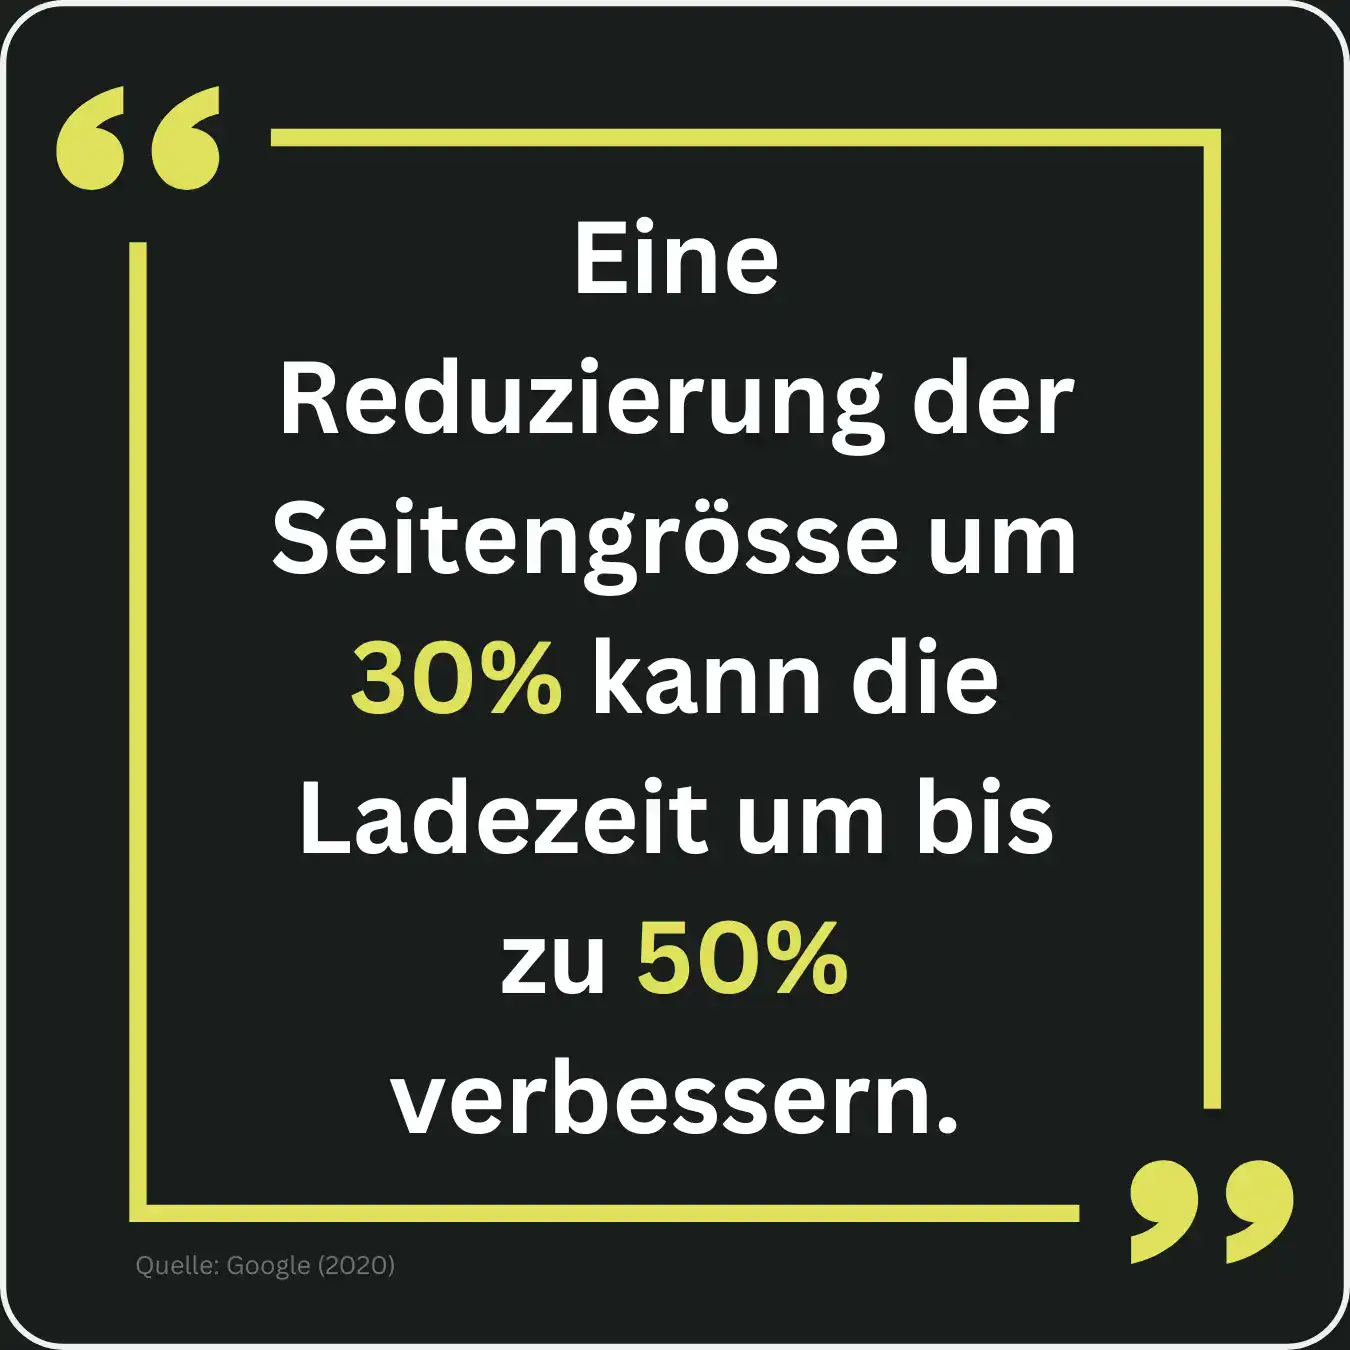
Reducing the page size by 30% can improve loading times by up to 50%.
(Google, 2020).
Pages with fewer than 500 words are less likely to rank in the top 10 results.
(Quelle: Backlinko, 2020)
Only 15% of websites are fully mobile-friendly.
(Source: SEMrush, 2020)
Keyword Statistics
Eine Optimierung für relevante Keywords ist essenziell, um SEO-Ergebnisse zu erzielen. Ich habe hier die wichtigsten Keyword-Statistiken zusammengefasst.
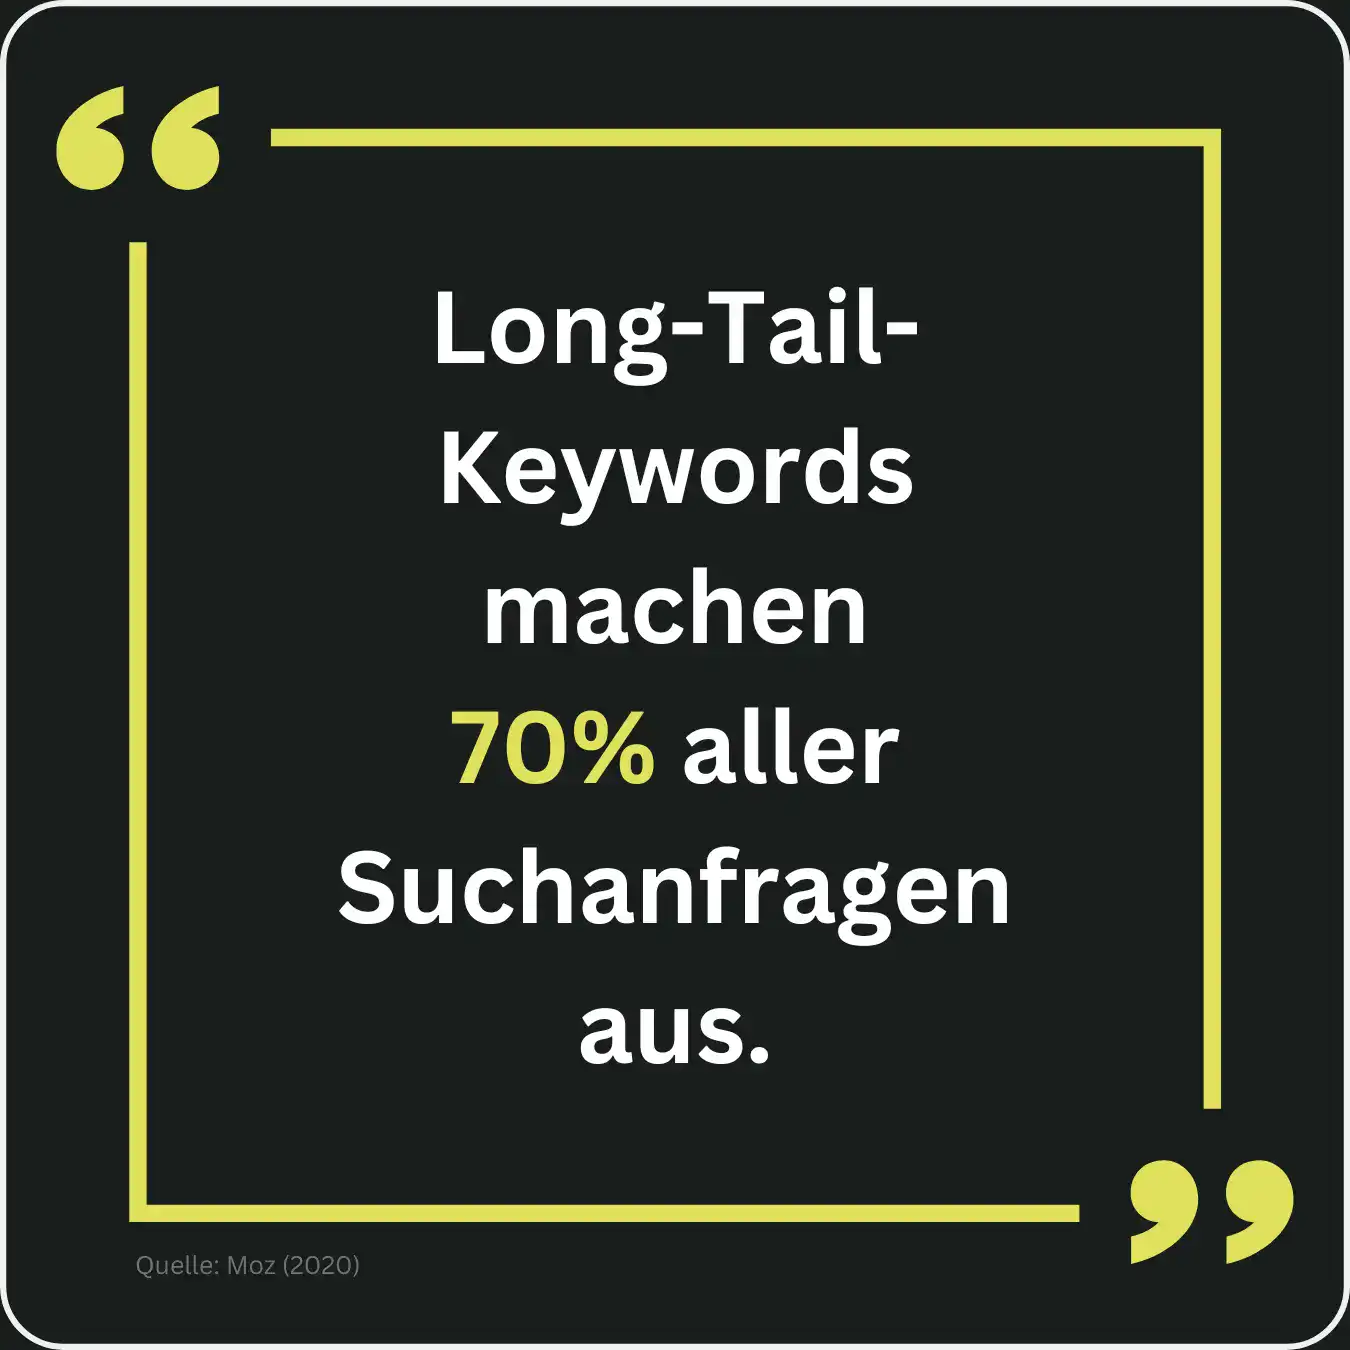
Long-tail keywords account for 70% of all search queries.
(Source: Moz, 2020)
The average conversion rate for long-tail keywords is 36%.
(Quelle: Smart Insights, 2020)
50% of search queries consist of four or more words.
(Quelle: WordStream, 2020)
Using keywords in the title increases the click-through rate by 2.5%.
(Source: Backlinko, 2020)
Seiten, die für ein Keyword ranken, ranken durchschnittlich auch für fast 1.000 weitere relevante Keywords.
(Source: Ahrefs, 2020)
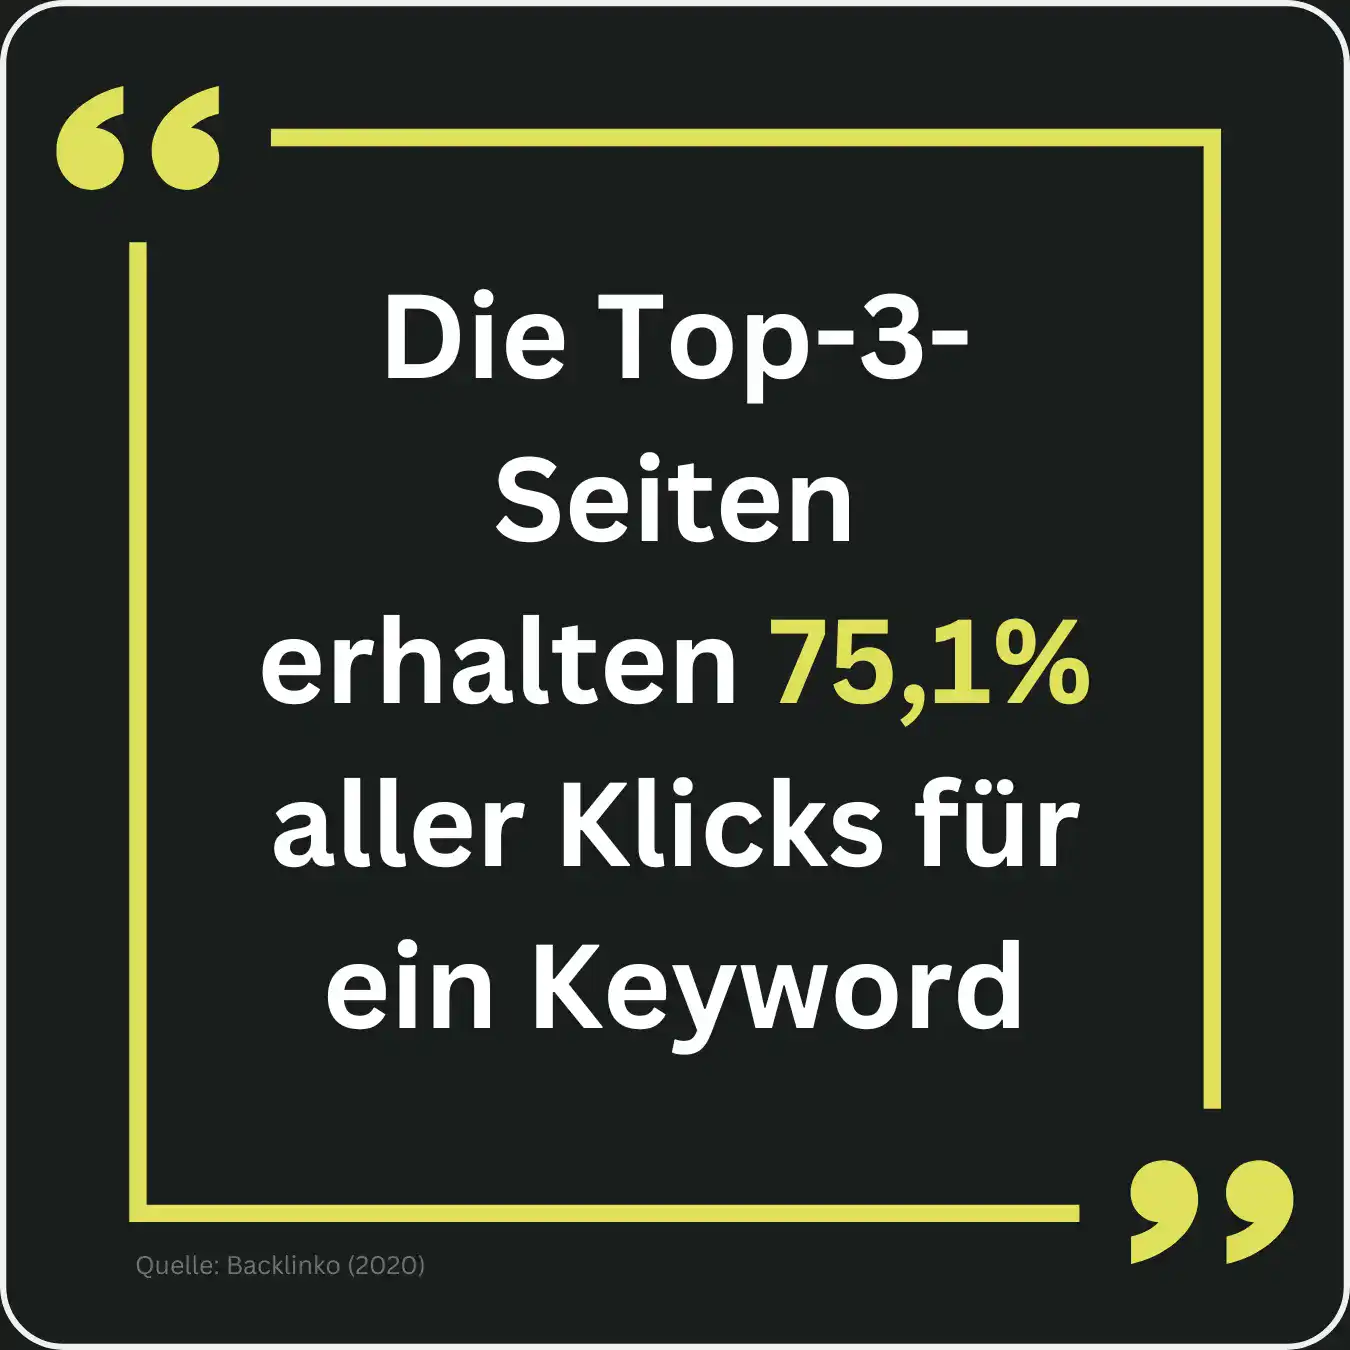
The top three results receive an average of 75.1% of all clicks for a given keyword.
(Source: Backlinko, 2020)
The average click-through rate for the first result is 31.7%.
(Quelle: Backlinko, 2020)
Only 0.78% of Google searchers click on a result on the second page.
(Quelle: Backlinko, 2020)
Die Verwendung von Fragen als Keywords kann die Wahrscheinlichkeit erhöhen, in Featured Snippets zu erscheinen.
(Source: SEMrush, 2020)
Bibliography
General Statistics
- Statcounter: “Search Engine Market Share Worldwide,” Statcounter Global Stats, 2024. URL: https://gs.statcounter.com/
- Backlinko: “We Analyzed 4 Million Google Search Results. Here’s What We Learned About Organic Click-Through Rate,” Backlinko, 2022. URL: https://backlinko.com/google-ctr-stats
- Search Engine Journal: “State of SEO 2023: Agency Report,” Search Engine Journal, 2023. URL: https://www.searchenginejournal.com/state-of-seo-report-2023
- Sparktoro: “Less than Half of Google Searches Now Result in a Click,” Sparktoro, 2023. URL: https://sparktoro.com/blog/less-than-half-of-google-searches-now-result-in-a-click/
- Google: “15% of Searches Are New Every Day,” Google Search Central Blog, 2022. URL: https://www.thinkwithgoogle.com/consumer-insights/
- Backlinko: “We Analyzed 11.8 Million Google Search Results. Here’s What We Learned About SEO,” Backlinko, 2022. URL: https://backlinko.com/voice-search-seo-study
- Ahrefs: “90.63% of Content Gets No Traffic From Google,” Ahrefs, 2020. URL: https://ahrefs.com/blog/search-traffic-study/
- Ahrefs: “How Long Does It Take to Rank in Google?”, Ahrefs, 2020. URL: https://ahrefs.com/blog/how-long-to-rank/
Mobile SEO Statistics
- Statista: “Mobile Search Statistics,” Statista, 2023. URL: https://www.statista.com/statistics/545967/mobile-search-share-of-total-search-queries/
- Google: “Mobile Page Speed Benchmarks,” Think With Google, 2022. URL: https://www.thinkwithgoogle.com/marketing-strategies/app-and-mobile/mobile-page-speed-new-industry-benchmarks/
- Google: “Importance of Mobile UX,” Think With Google, 2022. URL: https://www.thinkwithgoogle.com/marketing-strategies/app-and-mobile/importance-of-mobile-ux/
- Statista: “Search Engine Usage Frequency on Smartphones,” Statista, 2023. URL: https://www.statista.com/statistics/1080186/search-engine-usage-frequency-smartphone/
- Google: “Mobile Impacts Consumer Behavior,” Think With Google, 2022. URL: https://www.thinkwithgoogle.com/marketing-strategies/app-and-mobile/mobile-impacts-consumer-behavior/
- Google: “Consumer Insights: Local Search on Mobile,” Think With Google, 2022. URL: https://www.thinkwithgoogle.com/consumer-insights/local-search-mobile/
Local SEO Statistics
- Search Engine Roundtable: “Google Local Search Intent 46%,” Search Engine Roundtable, 2023. URL: https://www.seroundtable.com/google-local-search-intent-46-percent-28698.html
- Google: “Local Search Conversion Statistics,” Think With Google, 2022. URL: https://www.thinkwithgoogle.com/consumer-insights/consumer-trends/local-search-conversion-statistics/?utm_source=chatgpt.com
- Ranktracker: “77 Statistics for Digital Marketing in 2022,” Ranktracker, 2022. URL: https://www.ranktracker.com/de/blog/the-77-statistics-for-digital-marketing-in-2022-you-need-to-know/?utm_source=chatgpt.com
- Search Engine Land: “Research: 56% of Searches Have Local Intent,” Search Engine Land, 2014. URL: https://searchengineland.com/research-56-percent-go-searches-carry-local-intent-190655?utm_source=chatgpt.com
- SEO Tribunal: “Local SEO Statistics,” SEO Tribunal, 2023. URL: https://seotribunal.com/blog/local-seo-statistics/
- HubSpot: “Local Search Statistics,” HubSpot, 2023. URL: https://blog.hubspot.com/marketing/local-search-statistics
- BrightLocal: “Local Consumer Review Survey,” BrightLocal, 2023. URL: https://www.brightlocal.com/research/local-consumer-review-survey/
- Google: «Consumer Insights Local Search Mobile,» Think With Google, 2022. URL: https://www.thinkwithgoogle.com/consumer-insights/local-search-mobile/
Voice Search Statistics
- Google: “Voice Search Insights,” Think With Google, 2022. URL: https://www.thinkwithgoogle.com/consumer-insights/voice-search/
- BrightLocal: “Local Consumer Review Survey,” BrightLocal, 2023. URL: https://www.brightlocal.com/research/local-consumer-review-survey/
- Statista: “Worldwide Voice Search Usage,” Statista, 2023. URL: https://www.statista.com/statistics/973815/worldwide-voice-search-usage/
- Google: “Voice Assistants Insights,” Think With Google, 2022. URL: https://www.thinkwithgoogle.com/consumer-insights/voice-assistants/
- Backlinko: «Voice Search SEO Study,» Backlinko, 2022. URL: https://backlinko.com/voice-search-seo-study
Video Search Statistics
- Wyzowl: “Video Marketing Statistics,” Wyzowl, 2023. URL: https://www.wyzowl.com/video-marketing-statistics/
- Alexa: “YouTube Top Sites,” Alexa, 2023. URL: https://www.alexa.com/topsites
- HubSpot: “Video Marketing Statistics,” HubSpot, 2023. URL: https://blog.hubspot.com/marketing/video-marketing-statistics
- Tech.co: “Landing Page Video Conversion Rates,” Tech.co, 2015. URL: https://tech.co/news/much-impact-videos-landing-page-conversion-rates-2015-10
Backlink Statistics
- Backlinko: “Search Engine Ranking Study,” Backlinko, 2020. URL: https://backlinko.com/search-engine-ranking
- Ahrefs: “Search Traffic Study,” Ahrefs, 2020. URL: https://ahrefs.com/blog/search-traffic-study/
- Ahrefs: “Why Backlinks Die,” Ahrefs, 2020. URL: https://ahrefs.com/blog/why-backlinks-die/
- Ahrefs: “Nofollow Links Study,” Ahrefs, 2020. URL: https://ahrefs.com/blog/nofollow-links/
- Authority Hacker: “Link Building Statistics,” Authority Hacker, 2020. URL: https://www.authorityhacker.com/link-building-statistics/
Content Statistics
- SEMrush: “Long-Form Content Study,” SEMrush, 2020. URL: https://www.semrush.com/blog/long-form-content/
- Adobe: “Content Marketing Research,” Adobe, 2020. URL: https://www.adobe.com/insights/content-marketing-research.html
- Demand Metric: “Content Marketing Infographic,” Demand Metric, 2020. URL: https://www.demandmetric.com/content-marketing-infographic
- HubSpot: “Blogging Frequency Benchmarks,” HubSpot, 2020. URL: https://blog.hubspot.com/marketing/blogging-frequency-benchmarks
- Demand Gen Report: “2020 Content Preferences Study,” Demand Gen Report, 2020. URL: https://www.demandgenreport.com/resources/research/2020-content-preferences-study/
- ABG Essentials: “The Impact of Content Marketing,” ABG Essentials, 2020. URL: https://abgessentials.com/the-impact-of-content-marketing/
- HubSpot: “Blogging Statistics,” HubSpot, 2020. URL: https://blog.hubspot.com/marketing/blogging-statistics
- Content Marketing Institute: «Research Reports,» Content Marketing Institute, 2020. URL: https://contentmarketinginstitute.com/research/
Technical SEO Statistics
- Akamai: “Why Performance Matters,” Akamai, 2020. URL: https://www.akamai.com/blog/performance/why-performance-matters
- Pingdom: “Page Load Time and Bounce Rate,” Pingdom, 2020. URL: https://www.pingdom.com/blog/page-load-time-bounce-rate/
- Searchmetrics: “Core Web Vitals,” Searchmetrics, 2020. URL: https://www.searchmetrics.com/core-web-vitals/
- W3Techs: “HTTP/2 Usage Statistics,” W3Techs, 2020. URL: https://w3techs.com/technologies/details/ce-http2/all/all
- Portent: “Site Speed and Conversion Rates,” Portent, 2020. URL: https://www.portent.com/blog/analytics/site-speed-conversion-rates.htm
- Google: “Mobile Page Speed Benchmarks,” Think With Google, 2020. URL: https://www.thinkwithgoogle.com/marketing-strategies/app-and-mobile/mobile-page-speed-new-industry-benchmarks/
- Backlinko: “Search Engine Ranking Study,” Backlinko, 2020. URL: https://backlinko.com/search-engine-ranking
- SEMrush: “Mobile-Friendly Websites,” SEMrush, 2020. URL: https://www.semrush.com/blog/mobile-friendly-websites/